
Seismic screening and live monitoring.
Built for facility and asset managers, capital planners, and critical infrastructure owners.
You’re responsible for hundreds of buildings.
Detailed seismic assessments cost thousands per building and take months. So most portfolios get assessed one crisis at a time — after a scare, after a grant deadline, after someone asks a question nobody can answer.
Meanwhile the questions keep coming. Which buildings house our most vulnerable occupants? How much shaking can this building take? Where does the next dollar of seismic upgrade money do the most good?
Screening isn’t a replacement for engineering. It’s how you decide which buildings deserve an engineer.
Assess. Monitor. Simulate. Report.
Assess it yourself.
Answer a short set of structured questions about each building and FacilityShake returns a defensible vulnerability tier. Construction type, lateral force resistance, age against code era, height, irregularities, and the ground it sits on.
It works like a calculator wired into the building code — your answers run through Natural Resources Canada’s (NRCan) code-era and seismic-zone rules, together with the ground under the building, and it flags where a professional assessment is genuinely warranted. Your facility managers already know the important details.
Monitor real events, big and small.
FacilityShake watches the NRCan and USGS earthquake feeds and runs the ground-motion models of NRCan’s national hazard model against your buildings. Not a general alert — your facilities, ranked within minutes, compared against their building code era or known seismic resilience.
You have limited staff to assess buildings. This tells them where to go first.

Simulate the earthquake before it happens.
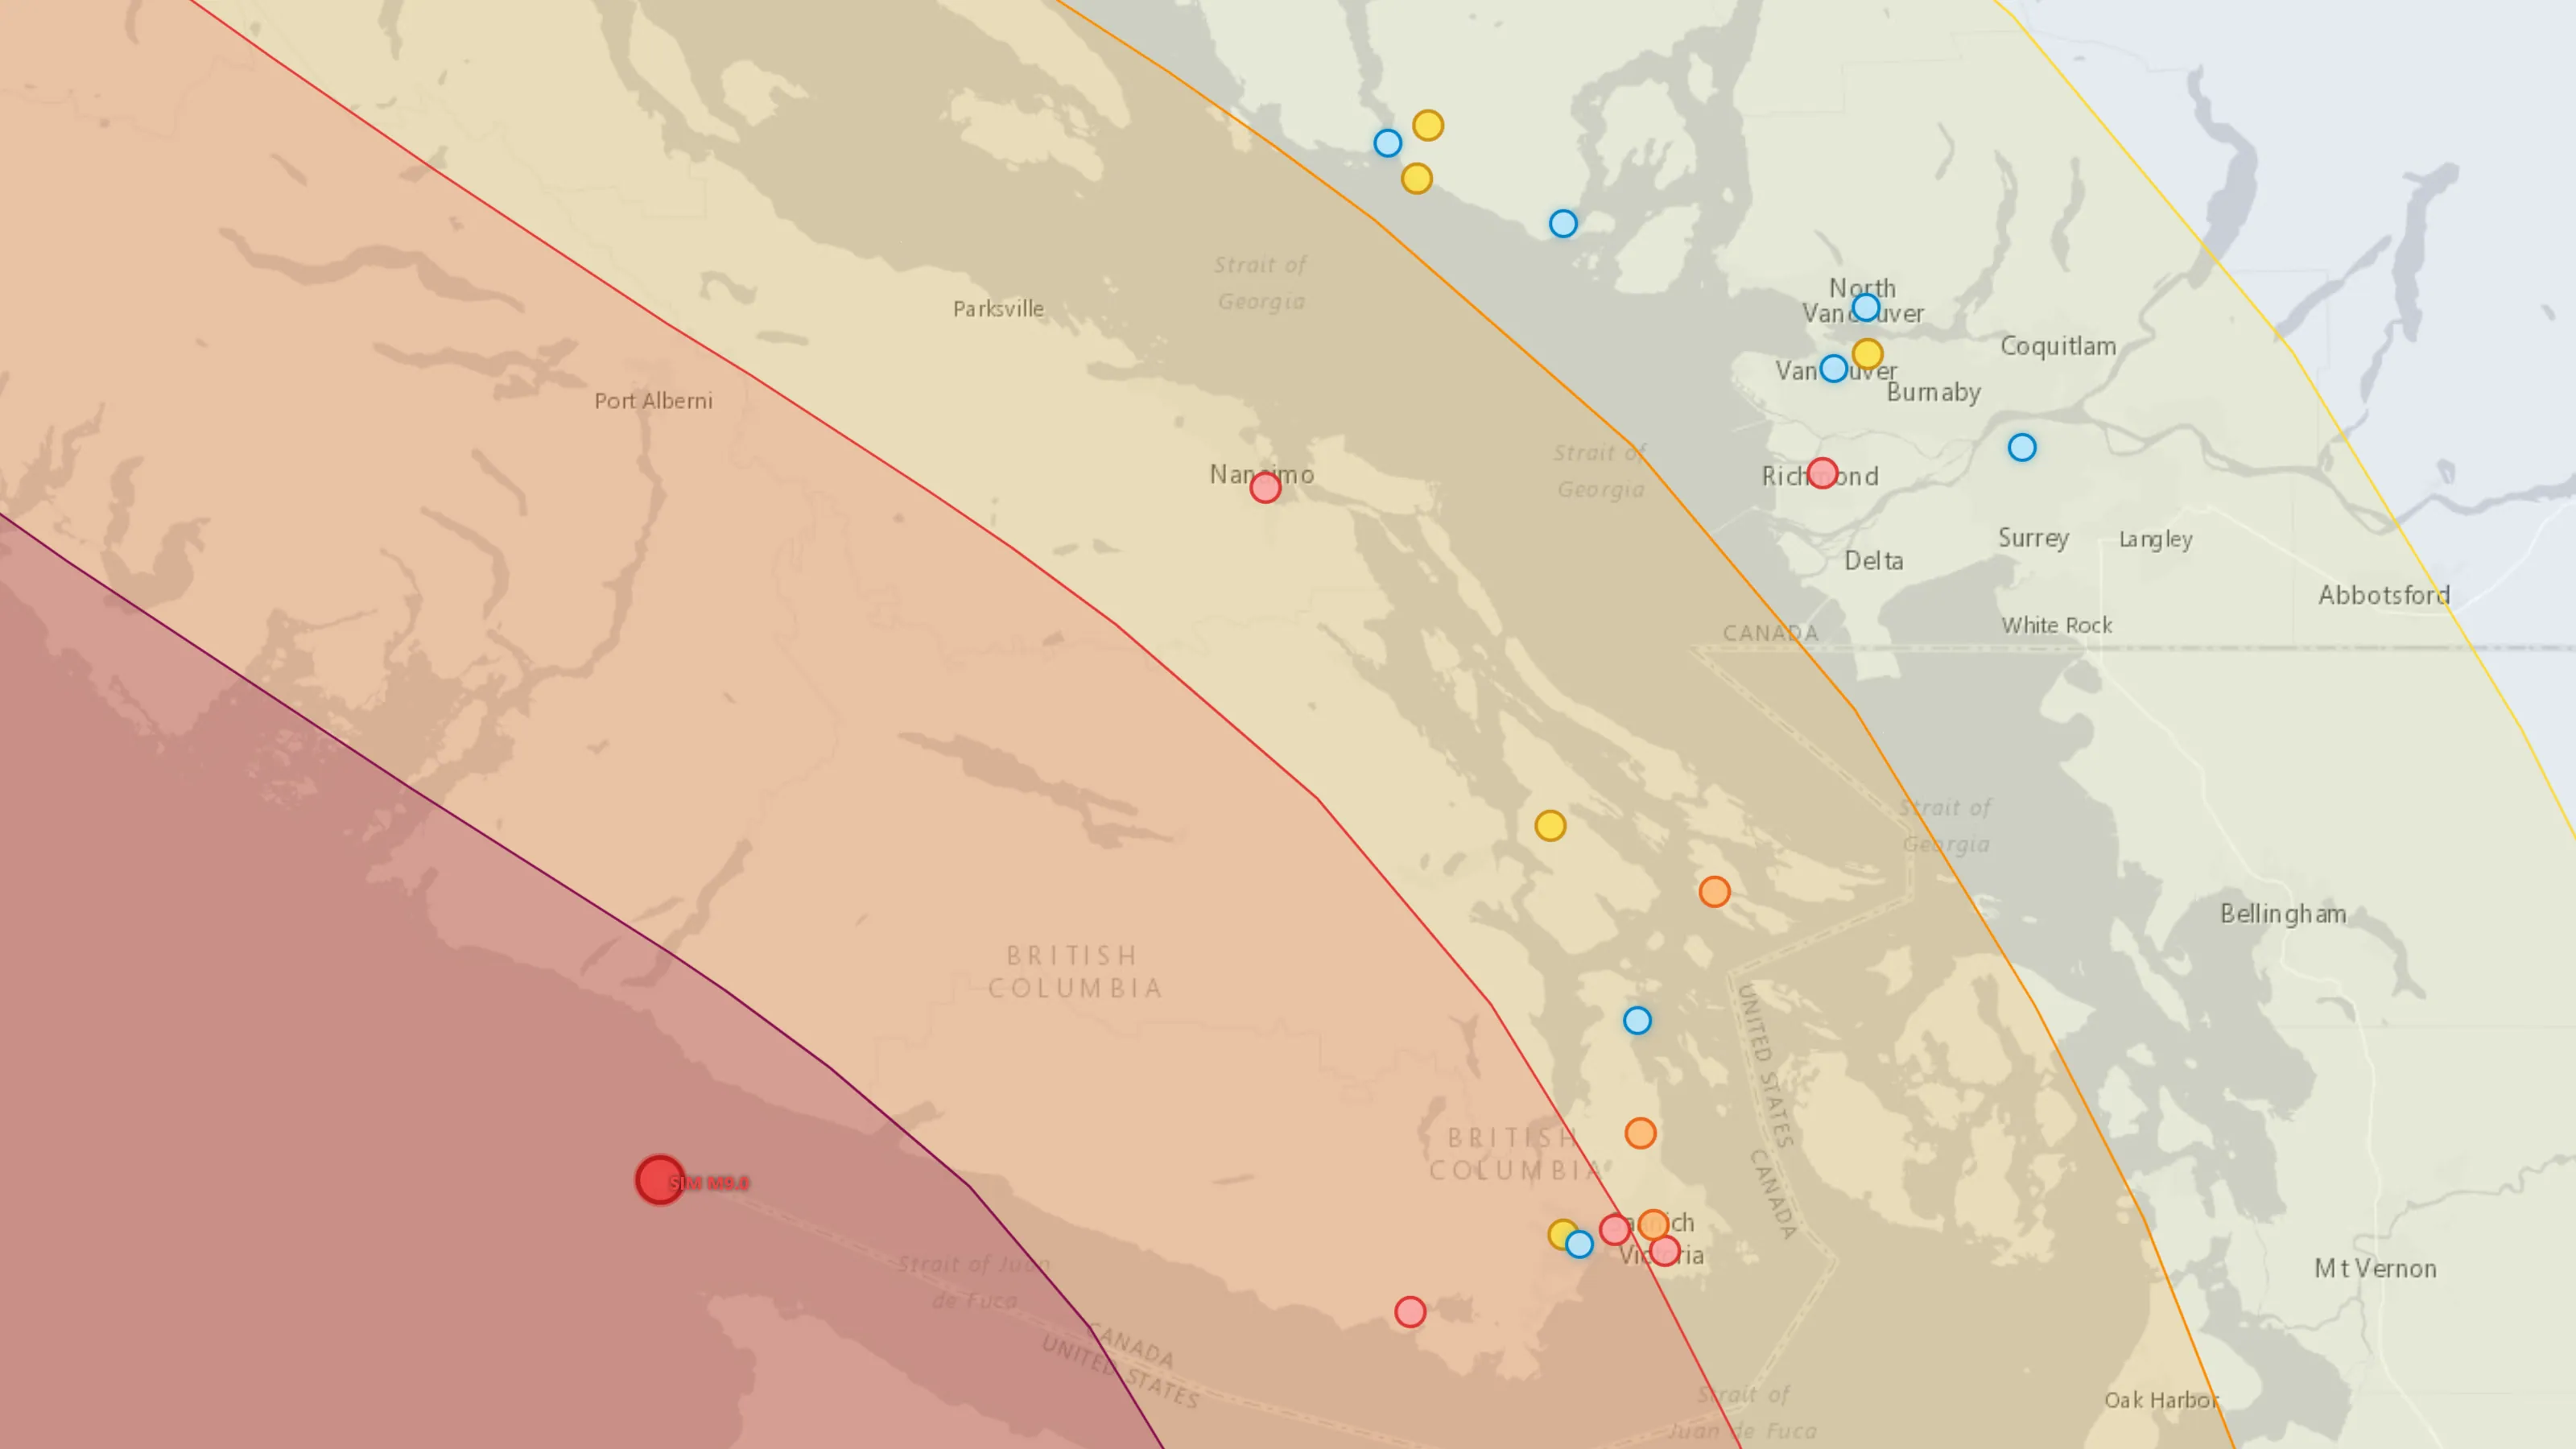
Model a specific event — a Cascadia subduction rupture, a local crustal fault — and see what it does to every building you own. Use it for exercise planning, continuity of operations, capital planning, and the budget conversation where someone asks what the risk actually is.
Pick an earthquake and watch it land on a real portfolio:
Many planning discussions are hypothetical: what if there were a quake here, and it was this big — what would happen? “What if” Quakes support exactly that discussion-based planning and exercising, using Natural Resources Canada’s ground-motion and damage models, finite-fault modelling, and your facility portfolio’s own building data.
It brings the hypothetical to life and grounds it in data — so the discussion stays productive.
You can put a tsunami notification into the exercise too — broadcast a Warning, Advisory or Watch to the official notification zones and see which of your facilities it reaches. That exercises the notification, not the wave: FacilityShake does not do tsunami mapping or inundation modelling. It does use that data where it has been published — telling you which of your buildings sit inside a modelled inundation zone (in BC, currently the Capital Region). Live BC tsunami alerts are issued through Emergency Info BC and Alert Ready; FacilityShake does not receive them yet.
Custom Quakes let you upload earthquake simulations created by you, your own GIS team, universities, or agencies. They also support CAP-CP alert XML files, so you can simulate earthquake alerts issued over the Alert Ready system — replayed offline against your buildings.


Custom quake
Run a simulation built by you, your GIS team, a university or an agency — or replay a CAP-CP alert.
Accepts CAP-CP alert XML plus contour and grid ShakeMap formats.
Report to whoever needs to know.
Screenings, rankings and scenario runs roll up into printable reports — facility cards for site managers, portfolio summaries for the council table, shelter guidance for emergency programs.
When a real earthquake happens the same machinery becomes an impact snapshot: who is worst hit, who needs a walkthrough, who can stay open. It goes to four places at once, because the operations centre, the site manager and the person who signs things are never in the same room.
When someone asks “can I see that?”, this is what you hand them.
One bar across the top carries it all — the M6.8 quake and the tsunami advisory — with every facility ranked. Fictional example portfolio.
Real portfolios. Real hazard data.
FacilityShake has been built against working datasets, not toy examples: public facility portfolios, schools, hospitals, recreation centres, residences.
Available for British Columbia, New Zealand, and Australia, with regional hazard models and terminology for each.
The hazard side is not our arithmetic. It is the published national hazard model, the published scenario catalogue and the live agency feeds — wired together and pointed at your addresses.
The science is already published and the data is already public. The little that is ours — where the rupture of a new earthquake is placed, and a small, stated inspection margin — is documented. FacilityShake stitches it together for you.
FacilityShake does not replace engineers, or a strong-motion network with live sensors on your buildings.
But that gold standard is often too expensive to reach — and an organization can spend hundreds of thousands on consulting before a dollar goes into an actual retrofit or seismic upgrade. Use this tool to prioritize the finite seismic budget you have, and to make sure every facility in your portfolio carries some level of awareness behind it for seismic planning.
Where the numbers come from.
The shaking comes from the ground-motion models of NRCan’s national hazard model, combined as NRCan combined them for its published BC earthquake scenarios. They turn magnitude, depth, fault type and distance into peak ground acceleration and spectral acceleration at 0.3, 0.6 and 1.0 seconds — the periods NRCan’s damage curves use — at the coordinates of each of your buildings, not averaged over a region.
Each building is read against the Canadian damage curves NRCan published with its national seismic risk model, at the design level NRCan assigns from the building’s era and seismic zone. Colours begin where those curves give an even chance of slight, moderate or extensive damage, read at the shaking × 1.046 — a small inspection margin, stated on every result. Tested held-out against NRCan’s own building-by-building damage for four large BC scenarios, it flags about 95 % of the buildings NRCan puts at moderate damage or worse as Orange or Red — pooled, on par with NRCan’s own median shaking; weakest right beside a crustal fault.
A large earthquake is not a point. Once rupture size starts to matter, the event is modelled as a rupture surface — on NRCan’s fault geometry where the earthquake lies on a known fault — and every building is measured to the nearest point of that surface. On a Cascadia run that is the difference between a comfortable number and a real one.
Live feeds from Natural Resources Canada and the United States Geological Survey, watched together. A Puget Sound earthquake shakes Victoria, so the border is not a filter.
Historic and deterministic scenario runs come from NRCan’s published earthquake scenario catalogue and Canada’s OpenDRR datasets. “The Big One” on your map is a documented rupture, not a magnitude we picked. Past earthquakes are re-run from their recorded location and magnitude, with the USGS’s measured shaking shown alongside where it exists.
The same earthquake does not arrive the same everywhere. Bedrock passes the shaking through; soft soil traps and amplifies it — on the softest ground a building can often shake two to four times harder than an identical building on rock a kilometre away. Ground type is one of the five things you enter, and it is applied to every result the NBC 2020 way: a known class is read at the most amplifying ground in its range, unknown ground as Class D with the C–E range it could be, and the ground-motion models apply their own site response at every period — which is why a facility can read above the shaking band drawn around it on the map.
A seismically resilient building built in 1999 is not the same as a seismically resilient building built in 2023 — codes change, and the ground-motion research underneath them changes too. FacilityShake accounts for both: every building is screened against the code era it was actually built under and the seismic zone it stands in, the way NRCan’s national risk model does it, from pre-code stock to modern code — not a generic average. And where a professional engineer has already assessed a building, you enter their numbers and the tool carries them from there.
Licensed to your organisation.
One licence covers your whole portfolio and everyone who works on it — unlimited users, always. The price is set by one thing: the number of facilities you screen. Start now and set yourself up in a few minutes — or ask, and we’ll set you up.
Campus
$5 per facility / month — 1 to 10 facilities
No minimum — one facility is $5 a month. Billed annually.
Perfect for single facilities, a few buildings, or small campuses with some additions and outbuildings.
- Live event monitoring and scenario simulation
- Assess facility additions and renovations
- Administrator and permission-based access
- Data hosted in Canada
- Custom branding
Portfolio
$4 per facility / month — 11 to 50 facilities
$4 applies to every facility, your first ten included — a saving worth two and a half facilities. Billed annually.
Manage a regional portfolio of facilities with multiple facility managers and critical contacts.
- All features included in the Campus plan
- Optional: we configure your FacilityShake system for you from your current data and fill the gaps with subject-matter experts — one-time fee
Enterprise
51+ facilities — managed licence
Flat annual fee, quoted per organisation.
- Everything in Portfolio
- We load your portfolio and keep it current, year after year
- Custom configurations
- Invoice or purchase order, aligned to your fiscal year
Prices are per month, billed annually; month-to-month billing is available at 20% more. Email alerts are included. SMS/RCS alerts are an optional add-on at $0.50 per facility per month ($5 minimum). Prices in Canadian dollars, plus applicable taxes. Invoicing and purchase orders available for organisations that need them.
Tell us about your portfolio.
A licence for a campus or a portfolio, a managed licence for a whole jurisdiction, a walkthrough, or a portfolio you would rather we loaded for you — say which and we will get back to you, a person, within a business day.
Want to set yourself up right now instead? Start now creates your organization in a few minutes; a licence request is for when you would like to talk first.
Start with one facility. If the result tells you something you didn’t know, do the rest of the portfolio.